

Most broker-owners have a rough sense of whether their brokerage is profitable. They know what their top producers are closing. They know roughly what the office costs to run. And somewhere in the middle, there's a number they're calling profit.
What most broker-owners don't have is a way to know whether that number is good.
Good compared to what? Compared to other brokerages their size? Brokerages in their market? Brokerages with a similar commission structure? Most of the "benchmarks" available in the industry are survey-based, self-reported, or built from public franchise data that doesn't reflect how most independent brokerages actually perform.
We built this piece from something different. 52,256 closed transactions across brokerages operating in 39 US states and 6 Canadian provinces. Actual payout data from Loft47's back-office platform — what agents received, what brokerages retained, what flowed to third parties, and how that breaks down by market, price point, and deal type.
These aren't survey responses. They're the numbers from real deals.
The headline most broker-owners find uncomfortable
Here it is.
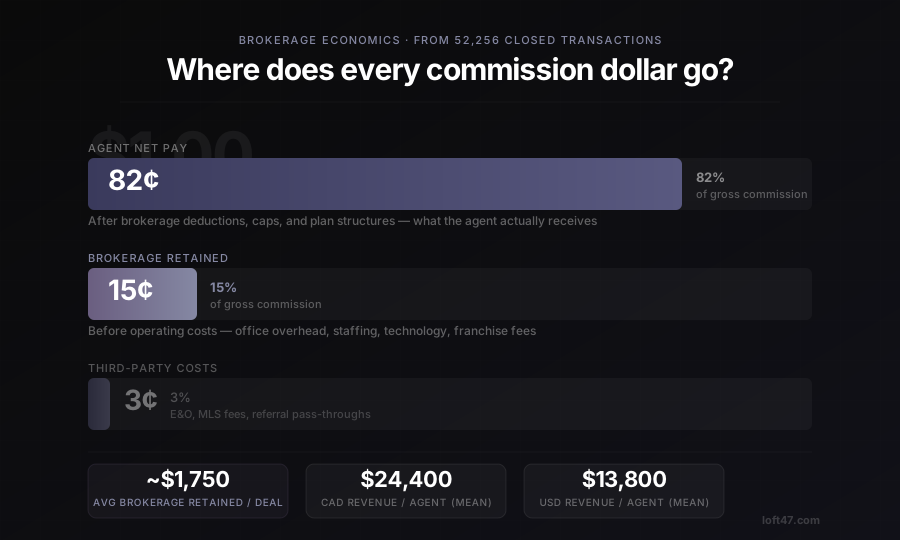
For every dollar of gross commission earned on a real estate transaction, the brokerage keeps approximately 15 cents.
The agent takes home around 82 cents. Third-party costs — E&O insurance, transaction fees, referral pass-throughs — account for the remaining 3 cents.
That's the industry-wide picture from our dataset. RealTrends' benchmarking arrives at a similar figure — roughly 13.8% gross margin for brokerage firms after paying agents, before operating costs. The two numbers aren't identical because they're measuring slightly different things, but they tell the same story.
Brokerage margins are thin. Volume is the only real path to profitability.
This is not news to most experienced broker-owners. But the implications are worth sitting with, because 15 cents on the dollar doesn't leave much room for error anywhere in the operation.
What "brokerage retained" actually means
The 15 cents isn't pure profit. It's gross retained revenue — what stays with the brokerage before operating costs.
From that 15 cents, you're covering:
Office overhead. Staffing. Errors and omissions insurance. Technology. Marketing. Recruiting costs. Compliance management. Any franchise fees or royalties if you're a franchise brokerage.
What's left after all of that is actual brokerage profit.
Most broker-owners don't track "brokerage retained per transaction" as a regular metric. They look at total revenue, total expenses, and whatever's left. The problem with that approach is that it makes it very hard to see which deals are actually contributing to the business and which ones are costing more to process than they're worth.
Tracking retained revenue at the transaction level is how you find that out.
Canadian vs US — a meaningful gap
The broad 15-cent picture is a blended number. When you split it by market, a meaningful gap appears.
Canadian brokerages in our dataset generate an average of $24,400 CAD per agent annually in retained brokerage revenue. US brokerages generate an average of $13,800 USD per agent.
That's a 77% difference, and it's not because Canadian brokerages are running more efficient operations.
Two structural factors drive it.
First, Canadian median sale prices are higher. Our dataset shows a Canadian median sale price of $415,000 CAD versus $315,000 USD in the US. Higher sale price means higher gross commission per deal, which means more dollars available to retain even at a similar percentage.
Second, Canadian commission rates are higher. The median rate in our Canadian dataset is 3.36% versus 3.00% in the US. The difference may seem small on paper, but compounded across deal volume, it produces meaningfully more gross commission per transaction.
The flip side is that Canadian brokerages also deal with a higher deal collapse rate compared to the 4.9% in the US. One in seven Canadian deals fails after going conditional. Each collapsed deal represents unrealized commission, and at $11,000 to $14,000 in average commission per failed deal, those collapses have a real impact on annual retained revenue.
So yes, Canadian brokerages generate more per agent. They also absorb more per deal that doesn't close.
What the data shows by price band
One of the more useful findings from the dataset is how commission dollars — not rates — vary by price band.
Most broker-owners know that commission rates tend to compress at higher price points. What's less intuitive is how dramatically the dollar amounts scale in the other direction.
A deal under $250,000 generates a median commission of approximately $4,500. A deal at $1M or above generates a median commission of approximately $75,000. That's a 16:1 ratio on the dollar, even though the rate on the higher deal is lower.
For the brokerage retaining 15 cents of each commission dollar, that difference is significant.
A brokerage closing 100 deals at $250,000 retains roughly $67,500 in gross brokerage revenue. The same brokerage closing 100 deals at $1M retains roughly $1,125,000.
Same deal count. Same operational overhead. Dramatically different profitability picture.
This is the mechanical reason why "chase the luxury listing" has always been advice that makes economic sense from a brokerage perspective. The agent earns more per deal. The brokerage retains more per deal. The administrative overhead per deal is roughly the same regardless of price point.
Where brokerages actually lose money without knowing it
The margin picture gets more complicated when you account for deal structures that generate less brokerage retained revenue than they appear to.
Team deals. Teams close more transactions per person. Roughly 3 times the per-person volume of solo agents. But team members earn approximately 25% less per payout than solo agents in our dataset. Some of that difference flows to the brokerage. Some flows to team leaders. The brokerage's net retained revenue per team deal often looks different from its retained revenue on a solo deal, and many brokerages don't track it separately.
Double-ended transactions. Deals where one agent represents both buyer and seller carry a 13-16% per-transaction premium in our dataset. They're typically concentrated at lower price points. The brokerage retains more gross commission on these deals. But they also require more careful compliance management, and errors are more likely when one agent is managing both sides.
Outside brokerage payouts. When commission is split with an outside brokerage, the funds flow through the trust account before being distributed. Tracking the brokerage's actual retained revenue on these deals requires precise ledger management. Brokerages that aren't tracking this carefully often discover they're retaining less per deal than they thought.
Manual entry errors. From our dataset, 37% of US deals and up to 46% of deals in some markets are still entered manually into back-office systems. Every manual entry is a potential calculation error. Commission errors don't always favor the agent — sometimes they overpay the brokerage, sometimes they underpay. But the pattern of errors almost always skews in a direction that requires correction, and corrections cost time and trust.
The metrics that actually tell you whether your brokerage is healthy
Most brokerages look at gross commission income as the primary performance metric. GCI is useful but incomplete. Here are the metrics that give you a cleaner picture.
Brokerage retained revenue per transaction. What does your brokerage actually keep after all agent payouts, on average, per closed deal? This number should be tracked by deal type, by price band, and by agent or team. If you don't know this number, you don't have a clear picture of which parts of your operation are profitable.
Brokerage retained revenue per agent. Not GCI per agent — what you keep after paying that agent. A high-volume agent on an aggressive cap structure might be generating significant GCI but very little brokerage retained revenue once the cap has been hit for the year. Knowing the net retained revenue per agent is how you evaluate whether your commission structure is working for the business.
Cost to process a transaction. Admin time, software costs, compliance management, trust accounting, errors and corrections. What does it cost your brokerage to close one deal? This is the number that tells you whether your back-office operation is a competitive advantage or a drag on margins.
Days from close to agent payout. In our dataset, US brokerages average 2.6 days from deal close to agent payout. Canadian brokerages average 4.5 days. Payout speed matters for agent retention. Agents at brokerages with faster, more reliable payouts report higher satisfaction with their brokerage relationship. Slower payouts are often a symptom of manual processes that create bottlenecks everywhere else too.
Deal collapse rate. This one is often invisible until you add it up. If your brokerage is processing 200 deals a year with a 10% collapse rate, that's 20 deals per year where you've invested admin time, compliance management, and trust account processing — and recovered nothing. At $11,000-$14,000 in average commission per collapsed deal, that's significant unrealized revenue. Tracking your collapse rate is the first step to understanding whether there's anything you can do to reduce it.
What good looks like
These benchmarks aren't universal. Market, price point, deal volume, commission structure, and overhead all affect what "good" actually looks like for a specific brokerage.
But some directional reference points from the data:
A brokerage operating in a market with median prices above $500,000, with clean trust accounting, automated commission processing, and agent payout speed under 3 days is well-positioned to retain more per transaction and spend less processing each one.
A brokerage running manual commission calculations, entering deals by hand, and reconciling trust accounts at month end with a spreadsheet is spending a meaningful portion of its retained revenue on back-office overhead — whether it tracks that cost explicitly or not.
The difference isn't always dramatic in any single month. Over a year, across hundreds of transactions, it compounds.
The profitability question most broker-owners can't answer
Here it is.
What did your brokerage retain per transaction last month?
Not what your GCI was. What you actually kept after all agent payouts, split by deal type, by price band, by agent.
If you can answer that question in under five minutes from your existing systems, your back office is working for you. If you can't, you're making profitability decisions based on incomplete information.
The brokerages in our dataset that track this at the transaction level consistently show cleaner trust accounting, faster payout timelines, and lower error rates. That's not coincidental. The discipline that produces good financial visibility tends to produce good operations generally.
How Loft47 fits into this
We built Loft47 specifically to give broker-owners the financial visibility that most back-office setups don't provide.
Commission management handles every deal structure automatically — splits, caps, team arrangements, outside brokerage payouts. Trust accounting reconciles in real time with a full audit trail. And brokerage retained revenue is tracked at the transaction level, not just as a quarterly accounting summary.
The 52,256 transactions in our commission report are from brokerages that have been running on this data every month. That's where the benchmarks in this piece come from.
If you want to see how your brokerage compares, the full 2026 State of Real Estate Commissions report is available at loft47.com/2026-state-of-real-estate-commissions. It covers commission rates, agent income, deal timelines, and brokerage economics across both markets in detail.
FAQ
What is a typical profit margin for a real estate brokerage?
Gross margin — what remains after paying agents but before operating costs — averages around 13-15% of gross commission income based on our transaction data and independent RealTrends benchmarking. Net profit margin after operating costs varies widely by brokerage size, market, and overhead structure. Brokerages with higher average sale prices, automated back-office operations, and lower deal collapse rates tend to operate at higher net margins.
How much does a real estate brokerage make per transaction?
In our dataset of 52,256 closed deals, brokerages retained approximately 15 cents of every commission dollar after agent payouts. On a median US transaction of $315,000 at a 3% commission rate, that works out to roughly $1,417 in gross brokerage retained revenue per deal. The actual number varies significantly by price band — from around $675 on a sub-$250K deal to over $11,250 on a $1M+ deal.
What is brokerage revenue per agent and why does it matter?
Brokerage revenue per agent is the total retained brokerage revenue divided by the number of active agents. It's a useful metric for evaluating whether your commission structure is generating adequate returns for the business. Our dataset shows Canadian brokerages averaging $24,400 CAD per agent and US brokerages averaging $13,800 USD — a gap driven primarily by higher Canadian sale prices and commission rates.
Why do brokerage margins vary so much by price point?
Commission rates tend to compress at higher property values, but the dollar amounts scale dramatically. A $1M+ deal generates roughly 16 times the commission dollar of a sub-$250K deal, even at a lower rate. For brokerages retaining 15 cents per commission dollar, this means significantly more gross retained revenue per high-value transaction — even though the operational cost to process that deal is roughly the same.
How can I improve my brokerage's profitability?
The most reliable levers are transaction volume, average deal value, commission structure design, and back-office efficiency. Specifically: tracking retained revenue per transaction and per agent (most brokerages don't), reducing manual data entry that creates errors and correction costs, improving payout speed to support agent retention, and knowing your deal collapse rate so you can see the true cost of deals that don't close.


.svg)
.svg)